
IIR explorer is a small Windows app to explore digital filters in an intuitive way: move poles and zeros on the complex plane and see in real time how this affects the magnitude and phase response of the filter.
Or you can select one of a few simple low pass filter designs and see how the poles move when you change the filter's cutoff frequency and Q factor.
The program assumes that you have a basic understanding of digital filters (sampling, discrete linear systems, z-transform, relationship between the unit circle and the filter response and stability).
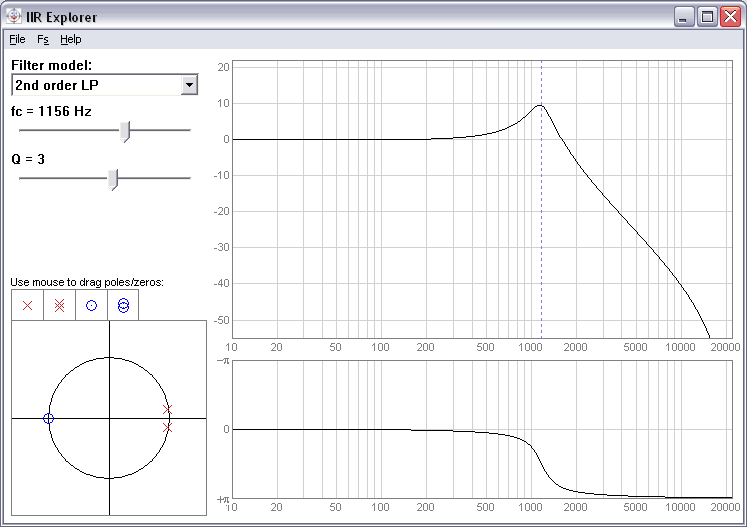
Here is how IIR Explorer looks:

The units on the magnitude response graph (the graph in the upper right corner) are Hertz for the x axis and dB for the y axis. The dashed vertical blue line shows the cutoff or center frequency of the filter.
To manually add poles and zeros, drag them from the palette above the unit circle plot to inside the z plane:
The phase response graph is below the magnitude response graph, while the crosshair in the bottom left corner represents the unit circle in the z plane and the position of the filter's zeros (blue circles) and poles (red crosses). At any time, you can use the mouse to drag zeros and poles around the z plane.
The Fs menu allows you to change the sampling rate at which the filter operates. (Audio applications range.)
To delete poles and zeros, either drag them outside of the z plane plot area, or right click on them and select Delete from the context menu. The same context menu also allows to switch between a single real pole (or zero) and a complex conjugate pair.
 One real pole.
 Two complex conjugate poles.
 One real zero.
 Two complex conjugate zeros.
© 2005 Daniele Terdina. All rights reserved.
Email